
Week 3: Make Claude Code Your Secret Weapon to Turn CSV and Excel Data into Strategic Insights (60 minutes → 90 seconds)
No Formulas, No Pivot Tables—Just Questions That Unlock Million-Dollar Insights

Last week's win: We organized hundreds of files into a more organized folder structure in 8 minutes using Claude Code. This week, let's make your data talk.
Remember that Downloads folder you organized? Those CSV files you found aren't just digital clutter—they're answers waiting to be discovered.
Free Practice Datasets for Week 3!
Before we get started this week, if you don't have a CSV handy, you can download our practice datasets:
Download Free Business Datasets
Sales performance data
Marketing campaign ROI analysis
Customer database with purchase history
Inventory management data
Employee satisfaction survey
Unzip the files (double-click). You will see cc4nc/data/csv/* and cc4nc/data/excel/*
The Problem Every Manager Faces
Your boss sends a quarterly sales spreadsheet. You need insights, but opening Excel feels like entering formula hell. You know the answers are there, but finding them means:
Building pivot tables that you will likely forget
Writing formulas that break when you look at them wrong
Spending 2 hours getting what should take 2 minutes
There's a better way.
The Claude Code Method: Talk to Your Data
Instead of fighting with formulas, ask questions in plain English:
"What were our top 3 products last quarter?""Which region is growing fastest?""Show me customers who haven't ordered in 6 months.""What's the trend in monthly revenue?"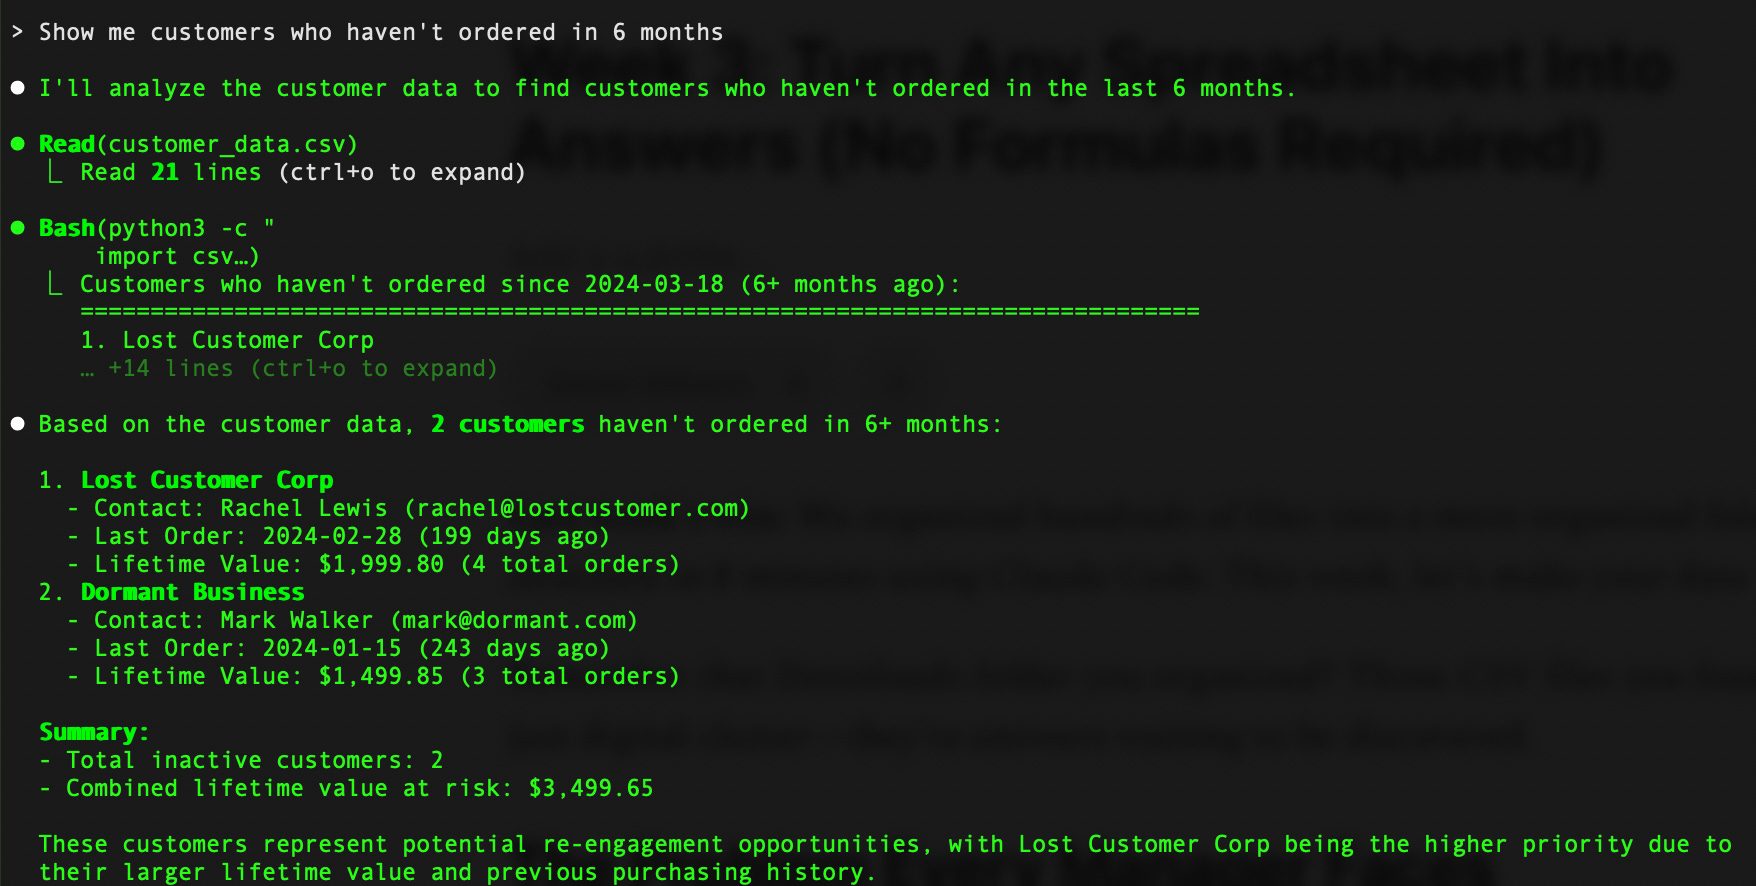
Claude Code reads your CSV or Excel documents and answers immediately. No VLOOKUP. No pivot tables. Just answers.
This Week's Challenge: The 5-Minute Analysis
What you'll do: Turn any CSV into business insights in under 5 minutes.
What you'll need:
Claude Code running on your computer (go back to Week 1 if you do not have Claude installed)
CSV file (sales data, customer lists, inventory, survey results, etc.)
5 minutes
Step 1: Start Claude Code & Confirm Python is Installed
Open your terminal and run:
cd Downloads/cc4cn && claudeDo I have Python installed? If not, please install it for me.Python is a scripting language that makes it easier to analyze complex data.
Step 2: Organize and Load Your Data
Please analyze the sales data from my csv folder: [copy and paste your CSV file here]or
Read the customer_data.csv file and show me the summaryStep 3: Ask Smart Questions
Start with these simple, but common, questions that work for most business data:
For Sales Data:
What's our average order value by month?Which products have the highest profit margins?Show me sales trends for the last 6 months.For Customer Data:
Who are our top 10 customers by revenue?Which customers haven't made a purchase in 90+ days?What's the average time between orders?For Inventory Data:
Which items are running low on stock?What's our inventory turnover rate?Show me products with zero sales last monthStep 4: Go Deeper
Claude Code's real power appears when you ask follow-up questions:
Why did Q2 sales drop?Which region is growing fastest?Show me customers who haven't ordered in 6 months.Create a summary for the executive team.What should we focus on next quarter?Pro Tip: Claude Code works best with well-structured data files that include:
Date columns (YYYY-MM-DD format recommended)
Clear column headers
Consistent data formatting
No merged cells or complex formatting
Analyzing the Data
Let’s walk through a scenario where you need to understand and explain what happened in Q2 2025.
Ask the initial question.
What's the trend in monthly revenue?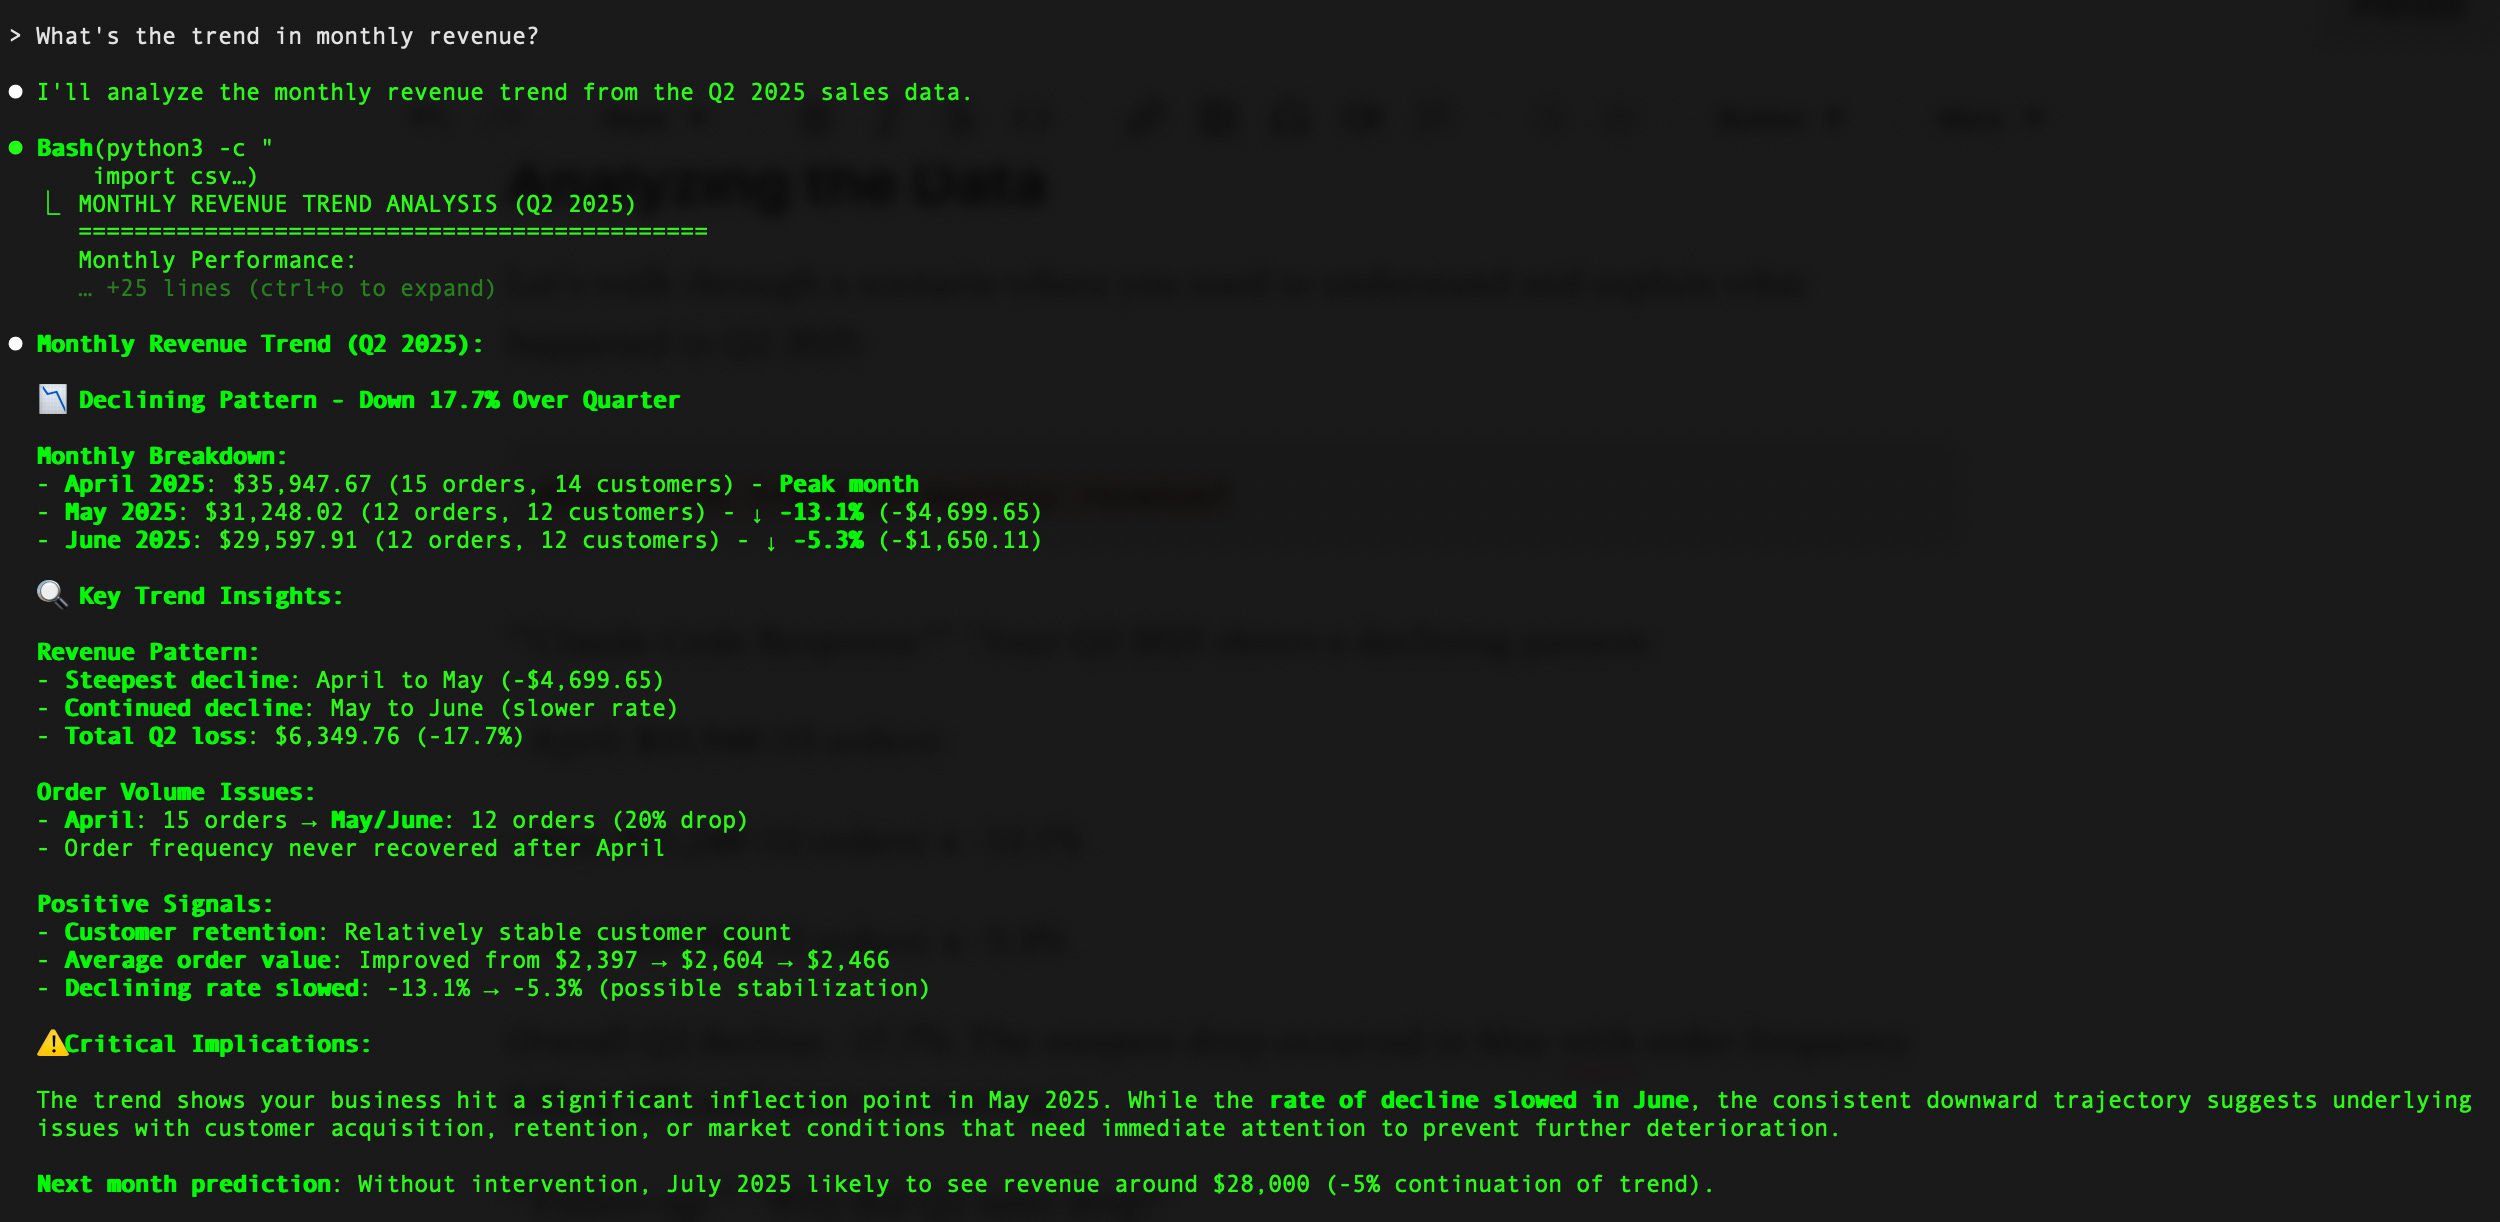
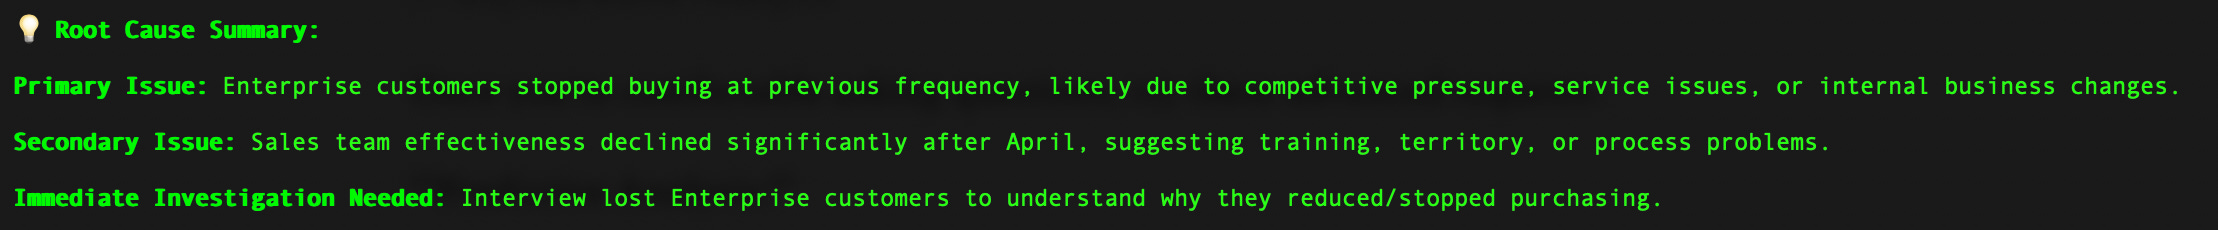
As a follow-up question:
Why did Q2 sales drop?Claude will likely respond with a detailed analysis along with a root cause summary:
Beyond Basic Analysis
Once you're comfortable asking questions, try these advanced requests:
Predictive Analysis:
Based on this data, what's likely to happen by end of this quarter (Q3 2025)?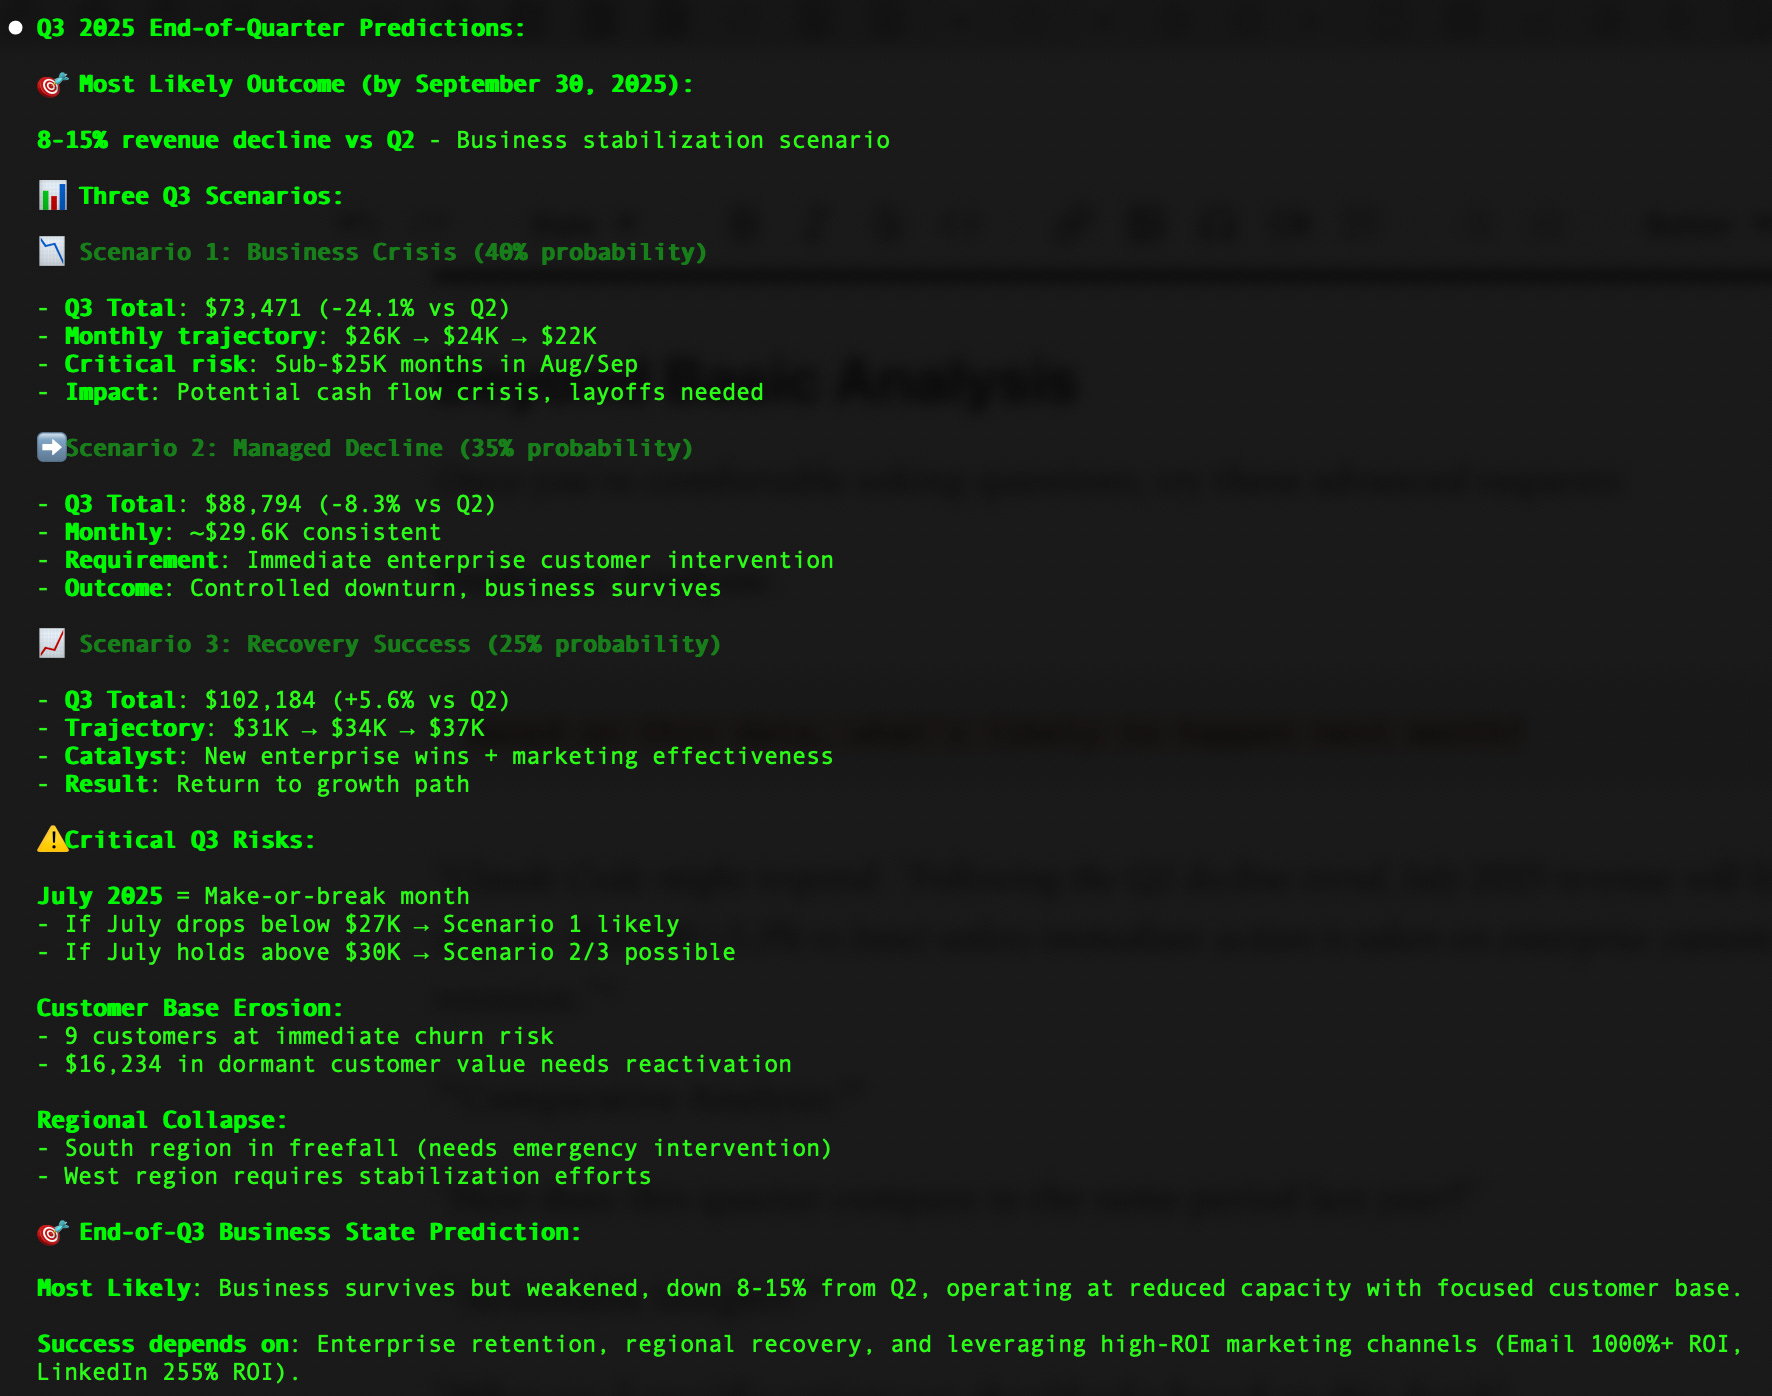
Comparative Analysis:
How does this quarter compare to the same period last year?Actionable Insights:
What are 3 specific actions we should take based on this data?Executive Summary:
Create a 3-bullet summary for leadership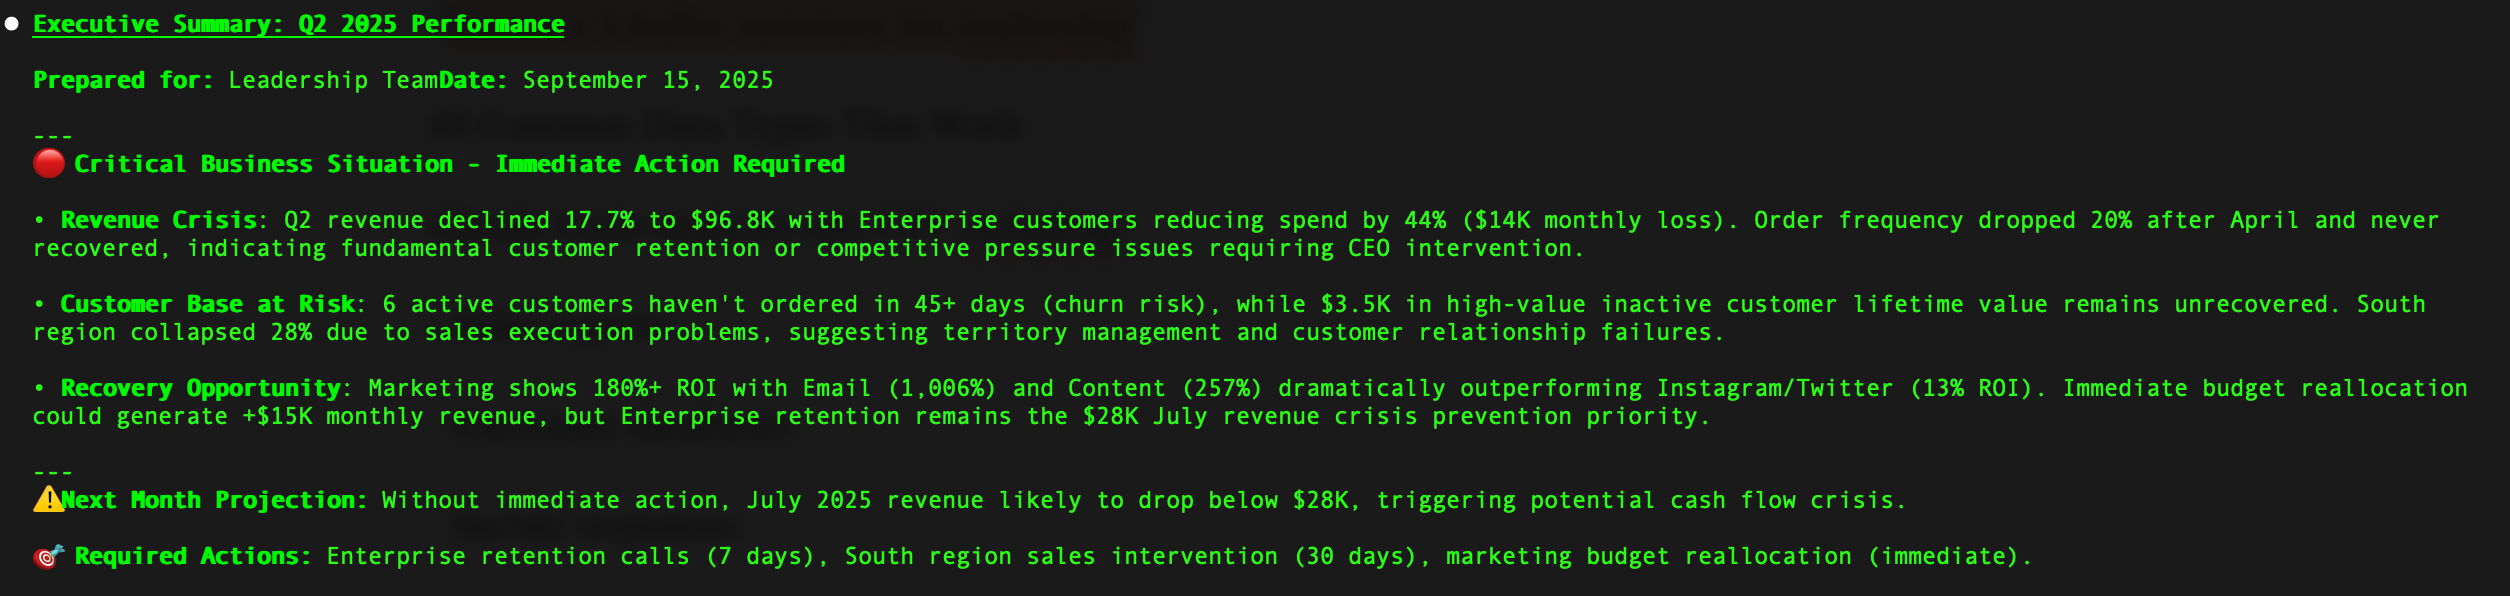
Common Data Types That Work
Claude Code analyzes any CSV, including:
Sales reports
Customer databases
Survey responses
Financial data
Inventory lists
Website analytics
Employee data
Marketing campaigns
Project timelines
Your Success Metric
Before Claude Code: How long does your typical data analysis take?
After this week:
Cut that time by 80% or more
Try analyzing data files from your
CRM (Salesforce, HubSpot, Dynamics 365, Pipedrive, Zoho)
ERP (SAP, Oracle NetSuite, Dynamics ERP, Workday)
Marketing & Analytics (Google Analytics/Ads, Adobe Analytics, Facebook Ads Manager, Mailchimp, HubSpot, Marketo)
Finance & Accounting (QuickBooks, Stripe, PayPal Business, FreshBooks)
HR (BambooHR, ADP, Workday)
Project Management (Asana, Monday.com, Jira, Trello, Microsoft Project, Smartsheet)
Survey & Feedback (SurveyMonkey, Typeform, Google Forms, Qualtrics)
Inventory & Operations (TradeGecko, QuickBooks Commerce, Fishbowl, inFlow Inventory, Cin7)
Next Week Preview
Week 4: "Automate Your Weekly Reports" - Turn this week's analysis into an automated system that updates itself.
Ready to turn your spreadsheets into insights?
Download Claude Code and try the 5-minute analysis challenge. Reply and tell me what you discovered in your data—I read every response.
Many readers saved hours last week organizing files. How much time will you save analyzing data this week?
Next Week's Topic Vote: Reply with A, B, or C
A) Create project folders for Claude Code
B) Create custom agents
C) Create reusable prompts